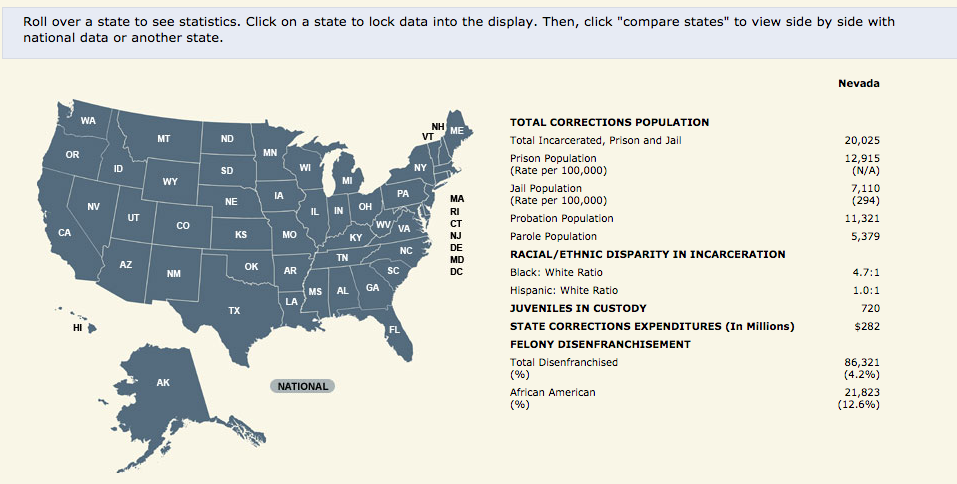
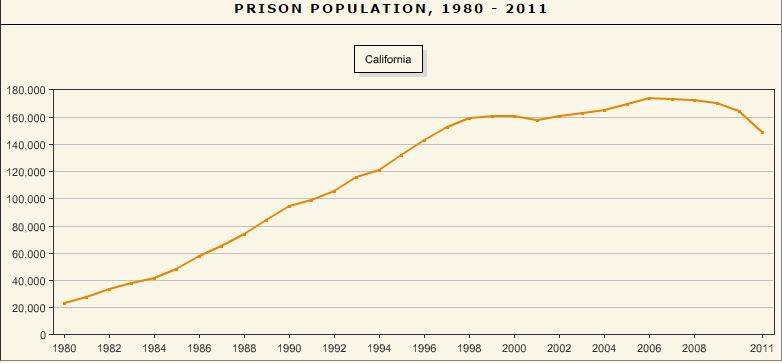
Prison populations began creeping up in the late 1970’s, exploding in the mid 1980’s. The graphics below represent a 500% increase over the past thirty years.
The Sentencing Project publishes “groundbreaking research, aggressive media campaigns and strategic advocacy for policy reform.”
Their interactive map shows prison statistics for each state:

Just below the map, choose any U.S. state and see its prison population growth from 1980 to 2011.

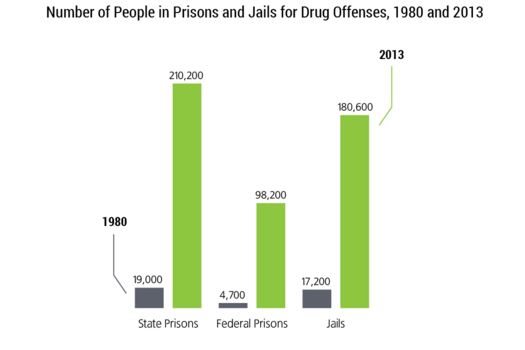
See here the effect the drug war has had on our “incarceration-mania,” as Piper Kerman calls it.

Also check out these fact sheets. Here’s a shocking statistic – as many as 100 million US citizens have a criminal record (that’s nearly one in three), which allows the state to legally discriminate against them – often barring them from voting. 126 million people voted in the 2012 presidential election. Imagine how felony disenfranchisement changes election outcomes, and why those in power might want to see that continue.


0 Comments